Audience Insights
Overview
Audience Insights allow you to analyze the audience performance over a selected time frame to understand which user segment has the highest impact for your personalized content. It provides both high-level aggregate metrics, and breakdowns across individual audiences and profile dimensions.
The “Insights” page is displayed on the Optimization tab in the Contentful web app.
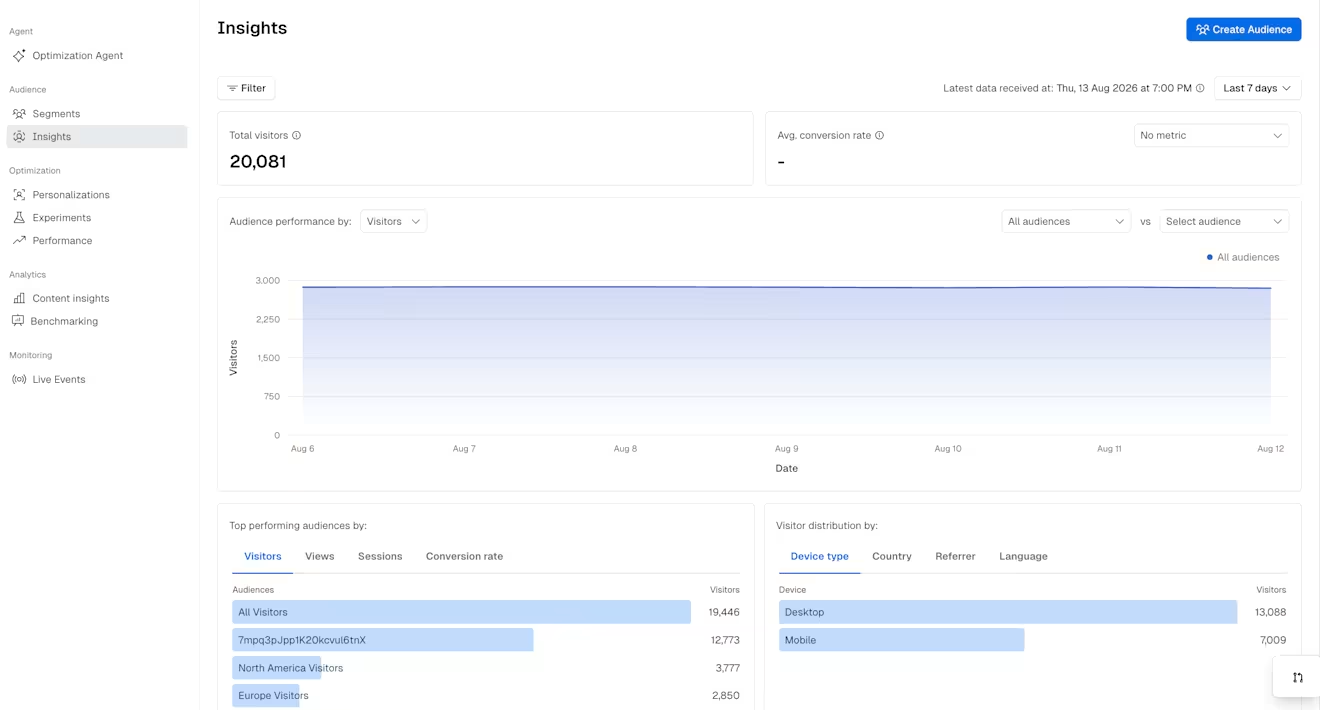
Audience Insights provide you with clear data for every experiment or personalization, such as:
Total audiences – The total number of audiences within the selected time frame that have at least one associated profile.
Total profiles – Represents the total number of unique profiles across all audiences in the selected time frame.
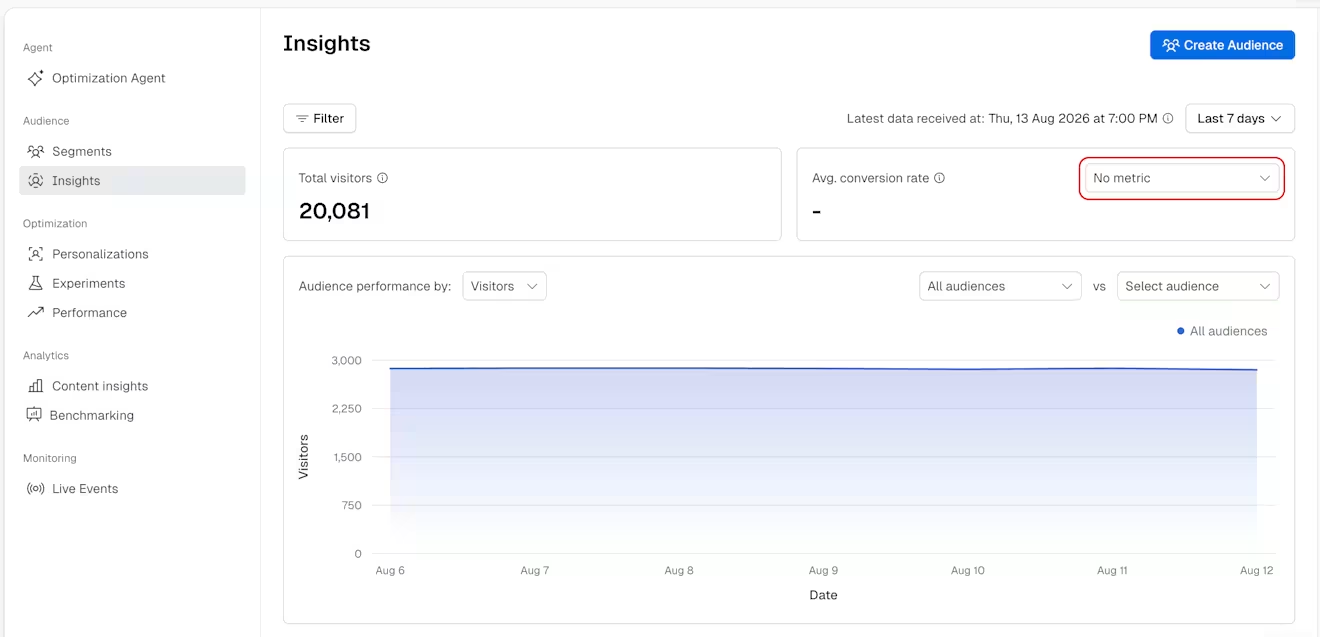
Average conversion rate – Displays the overall conversion rate across all audiences.
Calculated as: Total number of unique converters ÷ total number of profiles
NOTE: To have the Average conversion rate value displayed, you must first select a conversion metric from the drop-down menu.
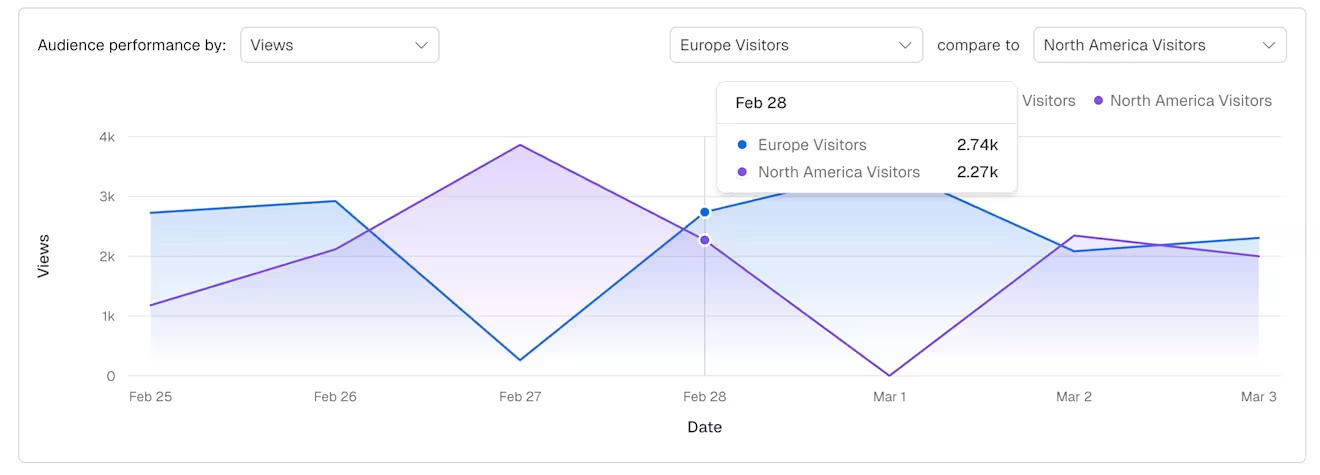
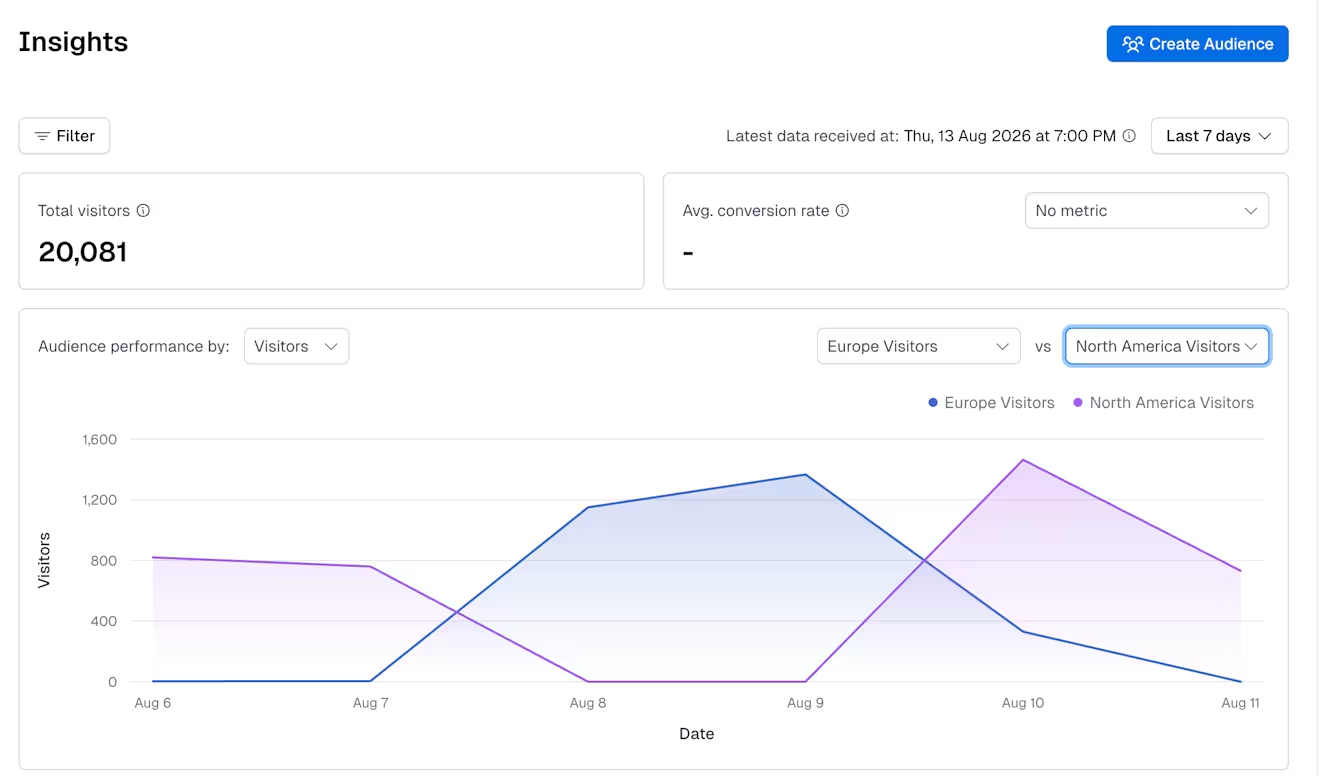
Audience breakdown – Displays the audience performance over time based on the selected metric, Visitors, Sessions or Views, with the option of comparing two audiences.
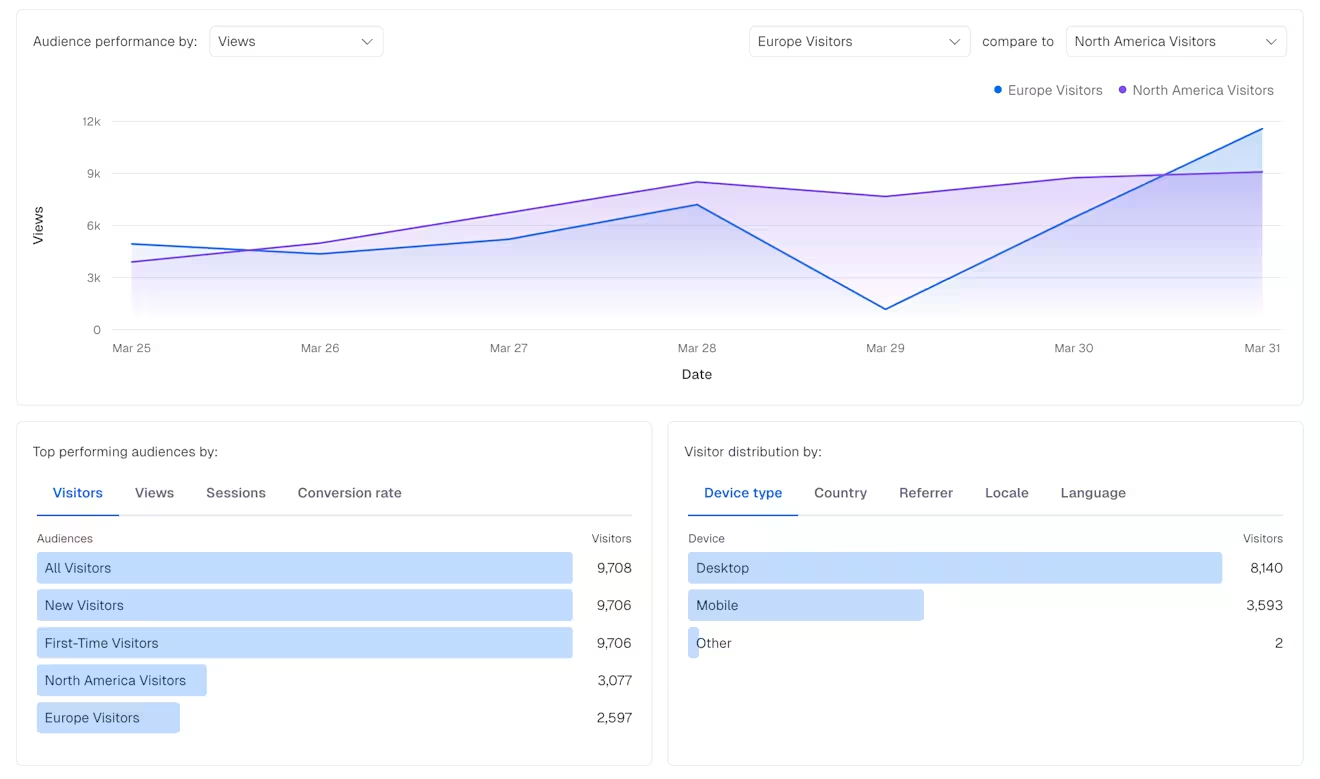
Top performing audiences by – Displays the five top-performing audiences, sorted by:
Number of visitors
Views
Sessions
Conversion rate
Visitor distribution by – Displays how visitor activity is distributed across key profile dimensions. Displays the top 5 values by number of views for each of the following:
Device type
Country
Referrer (source)
Locale (language + region)
Language
Audience breakdown
The Audience breakdown section is a time-series chart displaying the audience engagement by Views, Sessions or Visitors over a period of time, depending on the value selected. You can use the chart to track how audiences evolve over a selected period, and compare the size, views or sessions of two audiences using the audience selector:
Use cases
Track the overall performance of audiences over time.
Identify high-performing and underperforming audiences.
Understand who makes up each audience based on device, geography, and language.
Support optimization decisions for targeting, personalization, and experimentation.
Audience entry-level insights
Audience Insights are also available at audience entry-level. You can access them by selecting the "Insights" tab in any Audience entry.
This tab displays the number of profiles and sessions a specific Audience had over time.
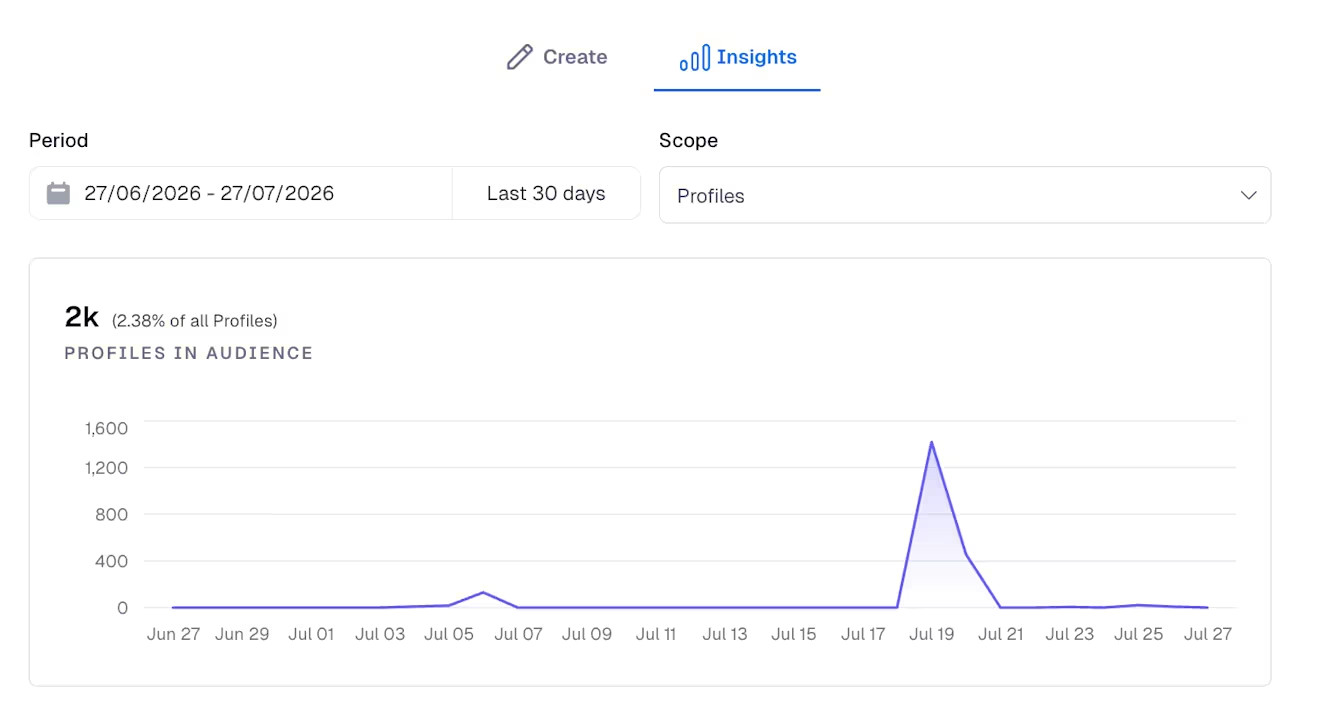
The main number and graph display the total number of active profiles (unique users) or sessions (periods of activity with no more than 30 minutes of inactivity) belonging to the audience within the given timeframe.
A profile or session is considered to belong to an audience starting with the first event that places them into that audience. Active means the profile or session have sent at least one event to Contentful Personalization within the specified timeframe.
The percentage displayed compares the number of active profiles or sessions that are in the selected Audience compared to the total number of all active profiles or sessions. For example, "60% of all profiles" indicates that 60% of all active profiles are in the selected Audience for the selected time frame.
NOTE: Profiles can belong to different audiences simultaneously.
The graph breaks down active profiles or sessions per 24 hour period, where a profile/session is also considered active if they have sent at least one Experience API event in the 24 hour period.
Use the Period and Scope fields to change the time period (X-axis) and count data (Y-axis) displayed in the graph.
Period
Select the time period to consider.
Scope
Select whether to display the count and history of Profiles or Sessions.
Profiles display the number of active unique profiles in the Audience.
Sessions display the active number of periods of interaction with no more than 30 minutes of inactivity (the same specification used by Google Analytics) conducted by users belonging to the Audience.
NOTE: Data for Audience Insights is processed in near real-time in hourly intervals.